


Debugging is essential to the development process, and JavaScript developers are no exception. Regardless of project size, debugging is essential to ensure your code works. This article will explain the most useful debugging techniques for JavaScript developers. These techniques include using browser developer tools, setting breakpoints, and utilizing console statements. Using these methods, JavaScript developers can find and fix bugs. So, let’s dive in and start debugging!
What is Debugging?
Debugging is finding and fixing errors (also known as bugs) in computer code. This can include issues such as syntax errors, logical errors, or runtime errors. This is a critical part of the development process, guaranteeing that our code performs as expected.
The following sections will show several methods of debugging.
Using the browser’s developer tools
This set of debugging tools provides a range of functionalities to aid developers in debugging. These tools allow developers to inspect the HTML and CSS of a webpage, provide a console to detect errors, and much more. To test these tools, let’s create an example. Say we want to create a button on a webpage when we call a JavaScript function.
const createButton = function () {
  const button = document.createElement("button");
  button.innerHTML = "Click me 😁";
  document.body.appendChild(button);
};
But for some reason, we make a typo error when calling the function, and our button isn’t rendered.
createButon();
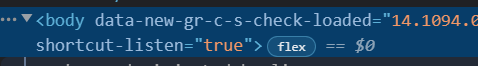
We can find this bug using our dev tools. To access the dev tools, we right-click on our page and click on inspect, and this opens up our dev tools on a sidebar.

To find our bug, we observe the elements tab. After discovering that element is not shown here, it is clear that our button element was never rendered.
We fix this bug by calling our function with its correct name to render our button.
createButton();
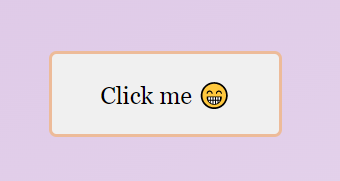
For further confirmation, we can inspect the dev tools for our element.
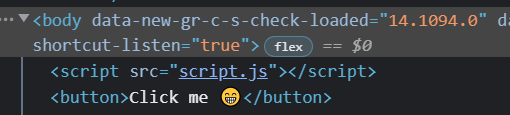
Thus, further proving our element was successfully rendered.
Using the JavaScript console
The JavaScript console is an integrated tool in web browsers designed to help developers communicate with their code as they work. It is a valuable tool for debugging, testing, and evaluating performance. It enables developers to input JavaScript commands, inspect the values of variables and objects and track error messages in real time. The console offers a vast selection of helpful debugging methods, including:
- The
console.logmethod: This method displays information on the console. This can be helpful when trying to understand the state of a variable or determining if a variable exists in a particular scope. Say we create two variables:
const num1 = 5;
const num2 = 6;
Then we attempt to perform an operation like this.
const sum = num1 + num2 + num3;
We get an error on the console.
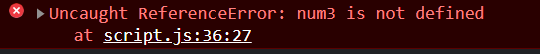
This error implies that we attempted to perform an operation with the variable num3, which we didn’t define in the current scope. To solve this bug, we define num3 before using it.
const num1 = 5;
const num2 = 6;
const num3 = 7;
const sum = num1 + num2 + num3;
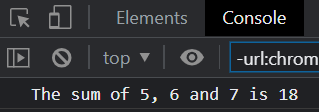
console.log(`The sum of ${num1}, ${num2} and ${num3} is ${sum}`);
And this yields the correct result.
This method is also useful for debugging functions. For example, if we have a function that takes in two arguments and returns their sum.
const calculateSum = function (a, b) {
  return a + b;
};
But when calling the function, we pass in a string as one of the arguments.
const result = calculateSum(2, "3");
Our result becomes a concatenation of a number and a string ‘23’ rather than the sum of both numbers.
To find our bug, we use the console.log method to log both arguments and use the typeof method to determine the data type of each argument.
const calculateSum = function (a, b) {
  console.log(typeof a);
  console.log(typeof b);
  return a + b;
};
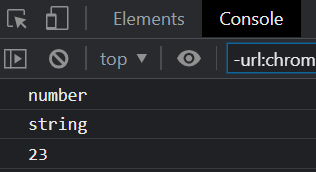
This shows that our second argument is a string instead of a number. To fix this bug, we convert the second argument to a number by adding a plus sign before the argument.
const result = calculateSum(2, +"3");
Our new result becomes
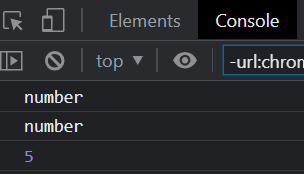
And with that, we’ve identified and fixed the bug in our function.
- The
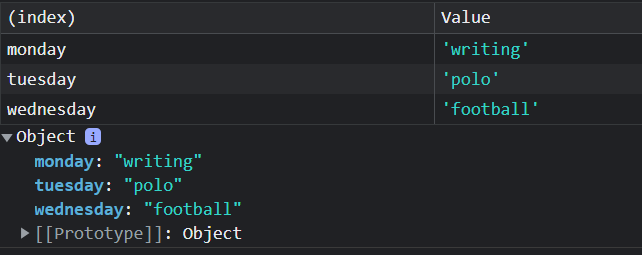
console.tablemethod: This method allows developers to log an array or object as a table in the console. Let’s create an object to display the result of aconsole.tablemethod.
const myHobbies = {
  monday: "writing",
  tuesday: "polo",
  wednesday: "football",
};
Then, we log that object to the console.
console.table(myHobbies);
This yields the result below.
This method is a great debugging tool when we want to check if the variable logged to the console is an array or object. If we logged a variable (not an array or object), the consoled result would be the variable’s value, without any tables. As an example, let’s log a number variable to the console.
const myNum = 10;
console.table(myNum);
- The
console.dirmethod: This method allows developers to inspect an object or array in the browser’s console more detailedly. Unlike theconsole.logmethod, it presents the information in an expandable format, making it easier to understand the structure of the object and its properties. Logging our previous object to the console with this method yields:
Like the console.table method, logging a variable (not an object or array) with this method only displays the value of that variable.
Session Replay for Developers
Uncover frustrations, understand bugs and fix slowdowns like never before with OpenReplay — an open-source session replay suite for developers. It can be self-hosted in minutes, giving you complete control over your customer data
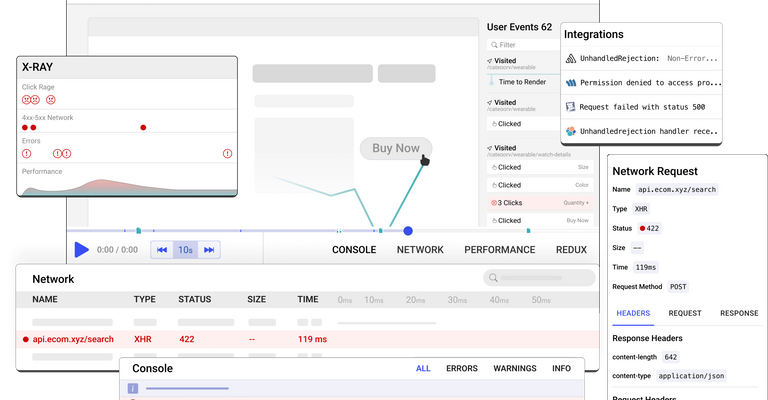
Happy debugging!Try using OpenReplay today.
Using a debugger
Developers use debuggers to identify and resolve bugs in their code. It enables the developer to pause the program’s execution, and examine variables. It also helps the developer step through the code line by line to understand how it works and identify bugs. Using a debugger involves three processes:
Setting breakpoints: This feature of debuggers allows developers to pause the execution of a program at a certain point. This allows the developer to examine the program’s state at that point and identify any issues or bugs. Keep in mind that we use the
debuggerkeyword to set a breakpoint.Stepping through the code: This technique allows developers to execute their code line by line in a controlled manner. It also aids developers in understanding the flow of the code and monitoring how the variables change with each line of execution.
Examining variable states: This involves monitoring the value of variables after each line of execution.
Let’s test these processes with an example containing a bug. First, we define the function:
const calculateArea = function (width, height) {
  let area = width * height;
};
Then we define two variables:
const rectangleWidth = 5;
const rectangleHeight = 10;
After that, we call the function with our variables as arguments.
const rectangleArea = calculateArea(rectangleWidth, rectangleHeight);
Finally, we log our result to the console.
console.log(
  `The area of a rectangle with width ${rectangleWidth} and height ${rectangleHeight} is ${rectangleArea}.`
);
Our result on the console becomes
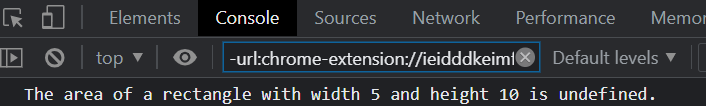
As we can see, our logged string returns an undefined value for the rectangleArea variable.
To find this bug, we set breakpoints by calling the debugger statement in our function.
const calculateArea = function (width, height) {
  debugger;
  let area = width * height;
};
Next, we open our dev tools and look at the sources tab. This tab consists of two main sections. The left section displays all our code from our script, and the right section shows the state of all our variables in the function’s scope.
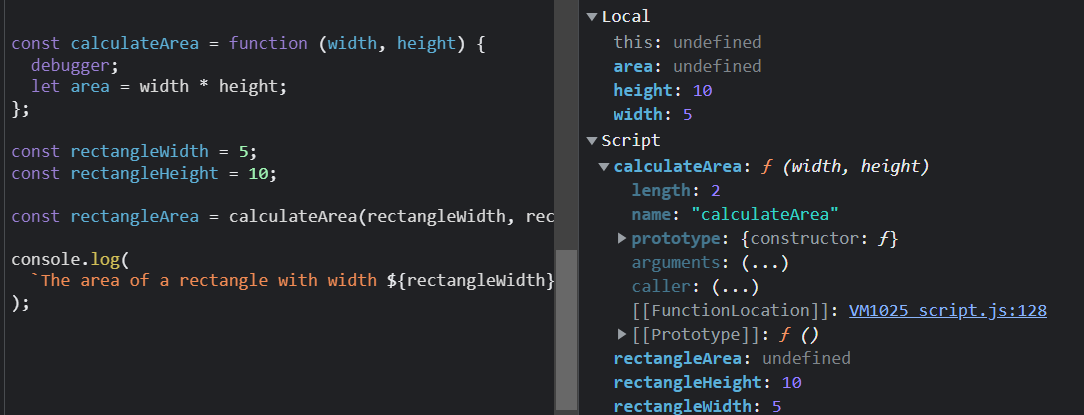
After inspection, we noticed that our area variable was undefined. This implies that our calculateArea function didn’t return any value.
To fix this bug, we return the result of that function area with the return statement.
const calculateArea = function (width, height) {
  let area = width * height;
  return area;
};
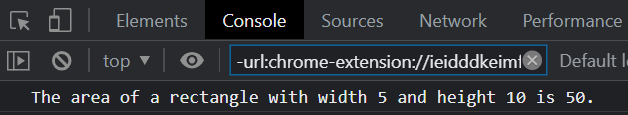
Logging our output to the console now yields:
Conclusion
To sum up, debugging is a critical component of software development and an integral part of the development cycle. Armed with these various techniques, JavaScript developers are equipped to handle any bugs that arise during the development process. From simple techniques like console.log to more sophisticated methods like breakpoints, developers have a full toolkit to identify and resolve bugs effectively. So as a JavaScript developer, the next time you encounter bugs while programming, remember that you have all the skills to debug it 😉!