When building a web application, you must consider the size of the assets used. Such assets are JavaScript, CSS, and images. Large files of these assets will slow down your application, negatively impacting your user experience. Webpack allows you to analyze and optimize the performance of your web apps. The analyzer presents you with a visual representation of the contents and size of the application bundles. Webpack generates the bundles for your application build process.
The Webpack bundle analyzer helps analyze the contents and size of the bundles generated during the build process. This makes identifying large files easier and optimizing the code for better performance. Using the generated bundle, the analyzer identifies any potential performance bottlenecks your application is exposed to. This way, you can use the Webpack bundle analyzer to reduce the bundle size and improve the performance of web applications. This tutorial will teach you how to improve your React application performance using Webpack Bundle Analyzer.
Setting up the bundle analyzer with React demo app
You will require a sample application to set up the Webpack bundle analyzer with React. In this tutorial, I created a sample React app on this GitHub Repository. Ensure you clone the application to your local computer, then proceed to its created directory:
cd speed_dial_app
Install the dependencies:
npm i
You can test the application by running the following development server command:
npm run start
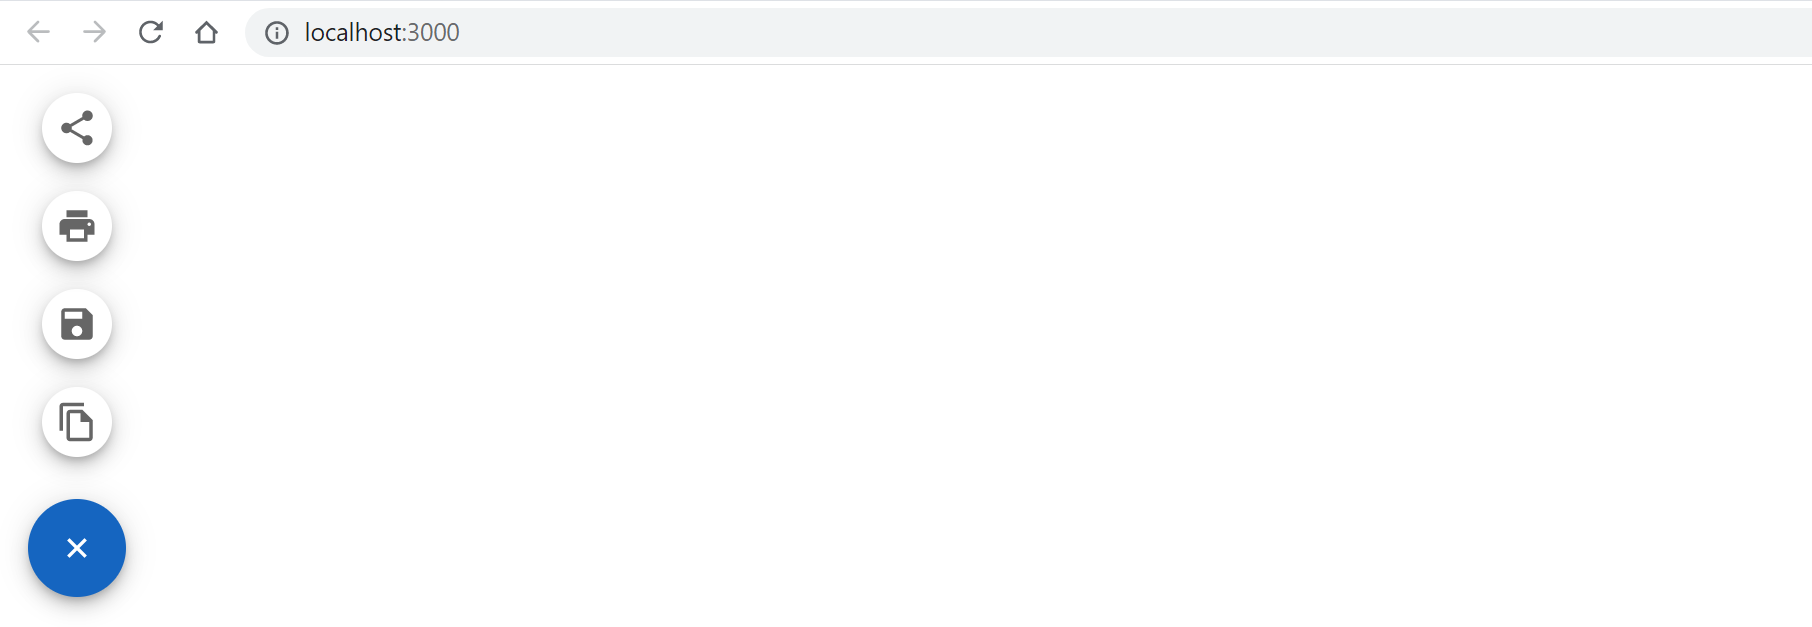
You should have the following sample demo application. You can set up the Webpack bundle analyzer with the crated React demo app. You need to install the webpack-bundle-analyzer package as a development dependency using the following command:
npm install -D @craco/craco webpack-bundle-analyzer
This will also install CRACO. CRACO (Create React App Configuration Override) is a configuration utility for Create React App. It allows you to extend and customize the build process of any Create React App projects without losing the benefits of the Create React App toolchain.
CRACO intercepts and modify the Webpack configuration used by Create React App. This provides a simple API for modifying the aspects of the Webpack configuration, including the build process’s entry point, output path, loaders, and plugins.
Once the above packages are installed for your project, create craco.config.js to hold the configurations for the analyzer as follows:
const BundleAanlyzerPlugin =
  require("webpack-bundle-analyzer").BundleAnalyzerPlugin;
// import the plugin
module.exports = function () {
  return {
    webpack: {
      // append Webpack configuration
      plugins: [new BundleAanlyzerPlugin({ analyzerMode: "server" })],
    },
  };
};
This will set up the Webpack Bundle Analyzer plugin with a React app using CRACO. This configuration object contains a new instance of the BundleAnalyzerPlugin, with a configuration object that sets the analyzerMode option to “server”. This tells the plugin to open a browser window with a live server that displays the bundle analysis report.
Scanning the application
Your React app can now use the Webpack Bundle Analyzer plugin to analyze your Webpack bundles. The bundle analysis report will automatically open in your default browser to check your development server, allowing you to visualize the size of your app’s bundles.
To scan and detect the application performance, run the following command:
npx craco build
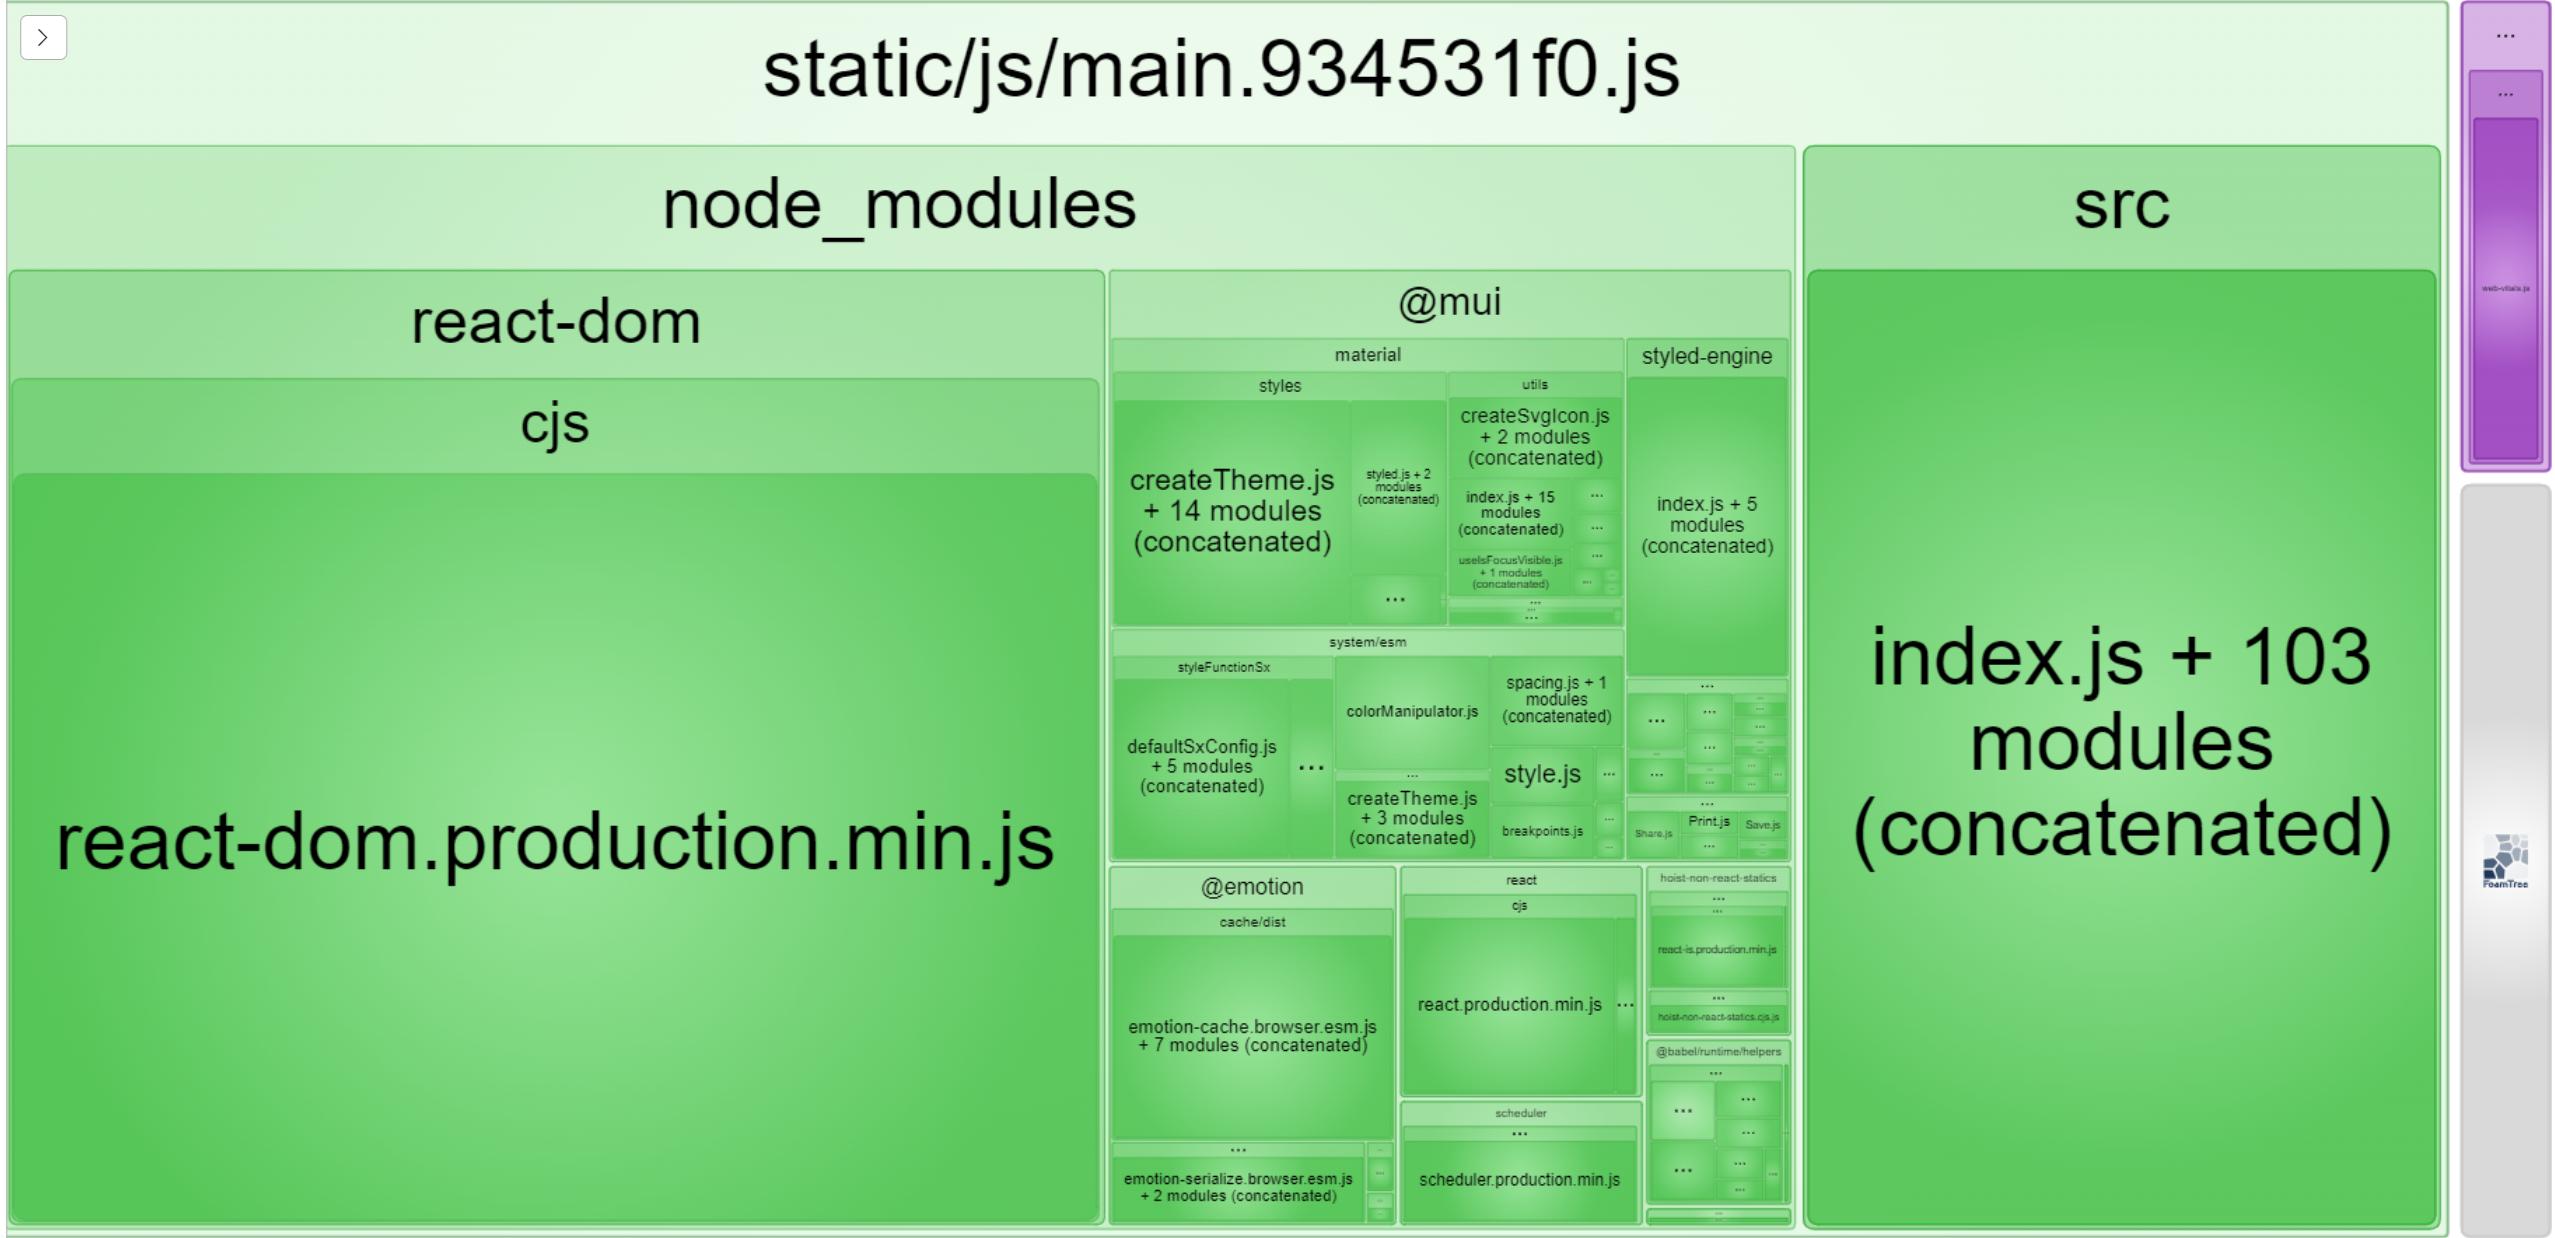
The above command will create an optimized production build and expose port 8888 to view the different bundle sizes. From 127.0.0.1, you should be able to get your bundles results as follows:
Analyzing results
From the above results, other than the core React modules, the following observations can be made:
- The total bandwidth used to load the page is 710KB, as shown here:

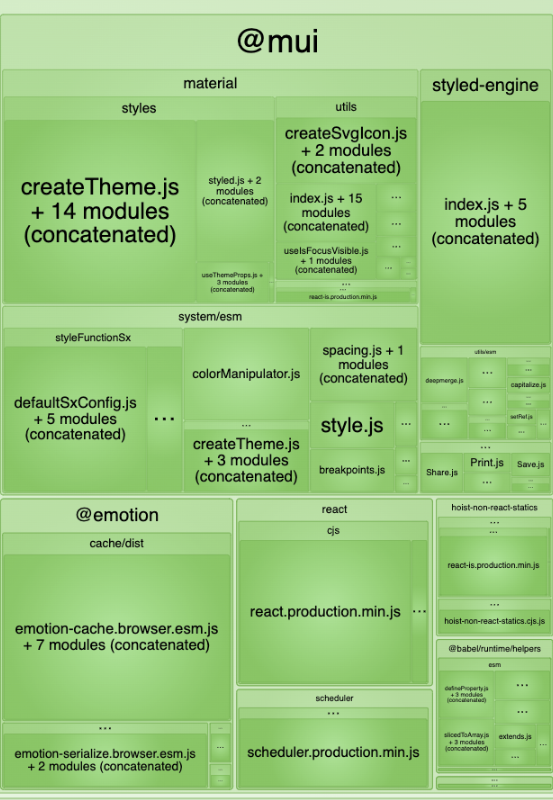
- Different modules of the Material UI package have been loaded, yet they are not being used by the current page, as shown in the below picture:
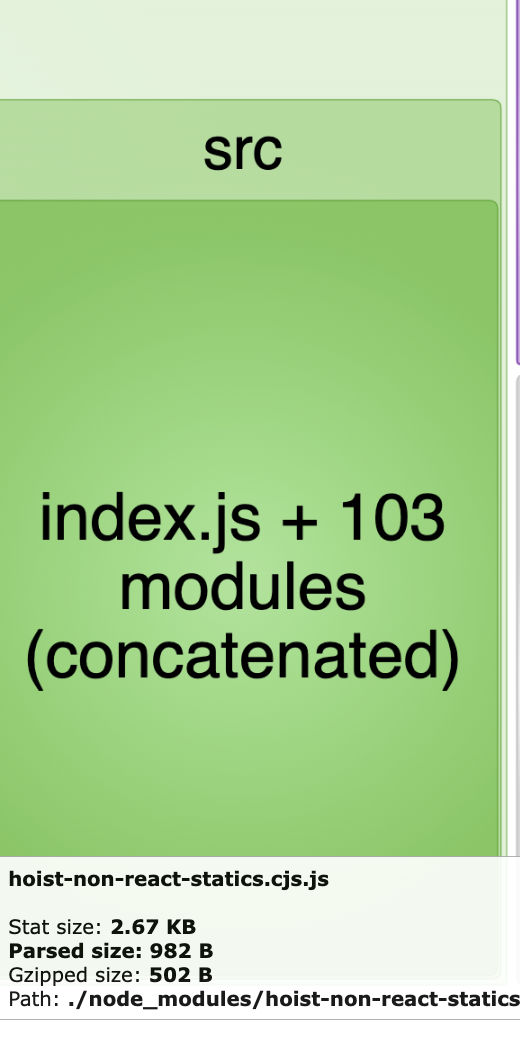
- Index.js loads 103 additional modules as shown below:
Let’s see how you can fix these results.
Fixing results
To fix the Webpack bundle analyzer report results, you can consider the following optimizations tips:
Code splitting large files into smaller and more manageable chunks.
Removing unused code.
Compressing assets such as images and fonts.
Lazy loading resources only when they are needed.
To fix the above results, you will use the following methods:
Only load the material UI component without loading the entire package.
Conditionally show the page once you click a button.
To load the material components individually, edit the SpeedDial.js as follows:
- Replace
import {Box,SpeedDial,SpeedDialIcon,SpeedDialAction} from '@mui/material';with:
import Box from '@mui/material/Box';
import SpeedDial from '@mui/material/SpeedDial';
import SpeedDialIcon from '@mui/material/SpeedDialIcon';
import SpeedDialAction from '@mui/material/SpeedDialAction';
This will only import what the application will use. To render the page conditionally, on App.js:
- Import the necessary packages:
import React,{useState,Suspense} from 'react';
import Button from '@mui/material/Button';
import CircularProgress from '@mui/material/CircularProgress';
- Import the SpeedDial once it is needed for Lazy loading:
const SpeedDial =
React.lazy(() => import('./SpeedDial'));
Inside the render function, maintain the show speed dial state:
const [showSpeedDial,toggleSpeedDial] = useState(false);
- Show speed dial if
showSpeedDialis true:
if (showSpeedDial) {
  return (
    <Suspense fallback={<CircularProgress />}>
      <SpeedDial />
    </Suspense>
  );
}
- Else, show a button to toggle button visibility:
else return (
  <Button variant="contained" onClick={() => toggleSpeedDial(true)}>
    Show Speed Dial
  </Button>
);
This is the current application that displays a button for conditionally loading the Speed Dial:

Now start the analyzer:
npx craco build
Your output should have a minimized bandwidth:
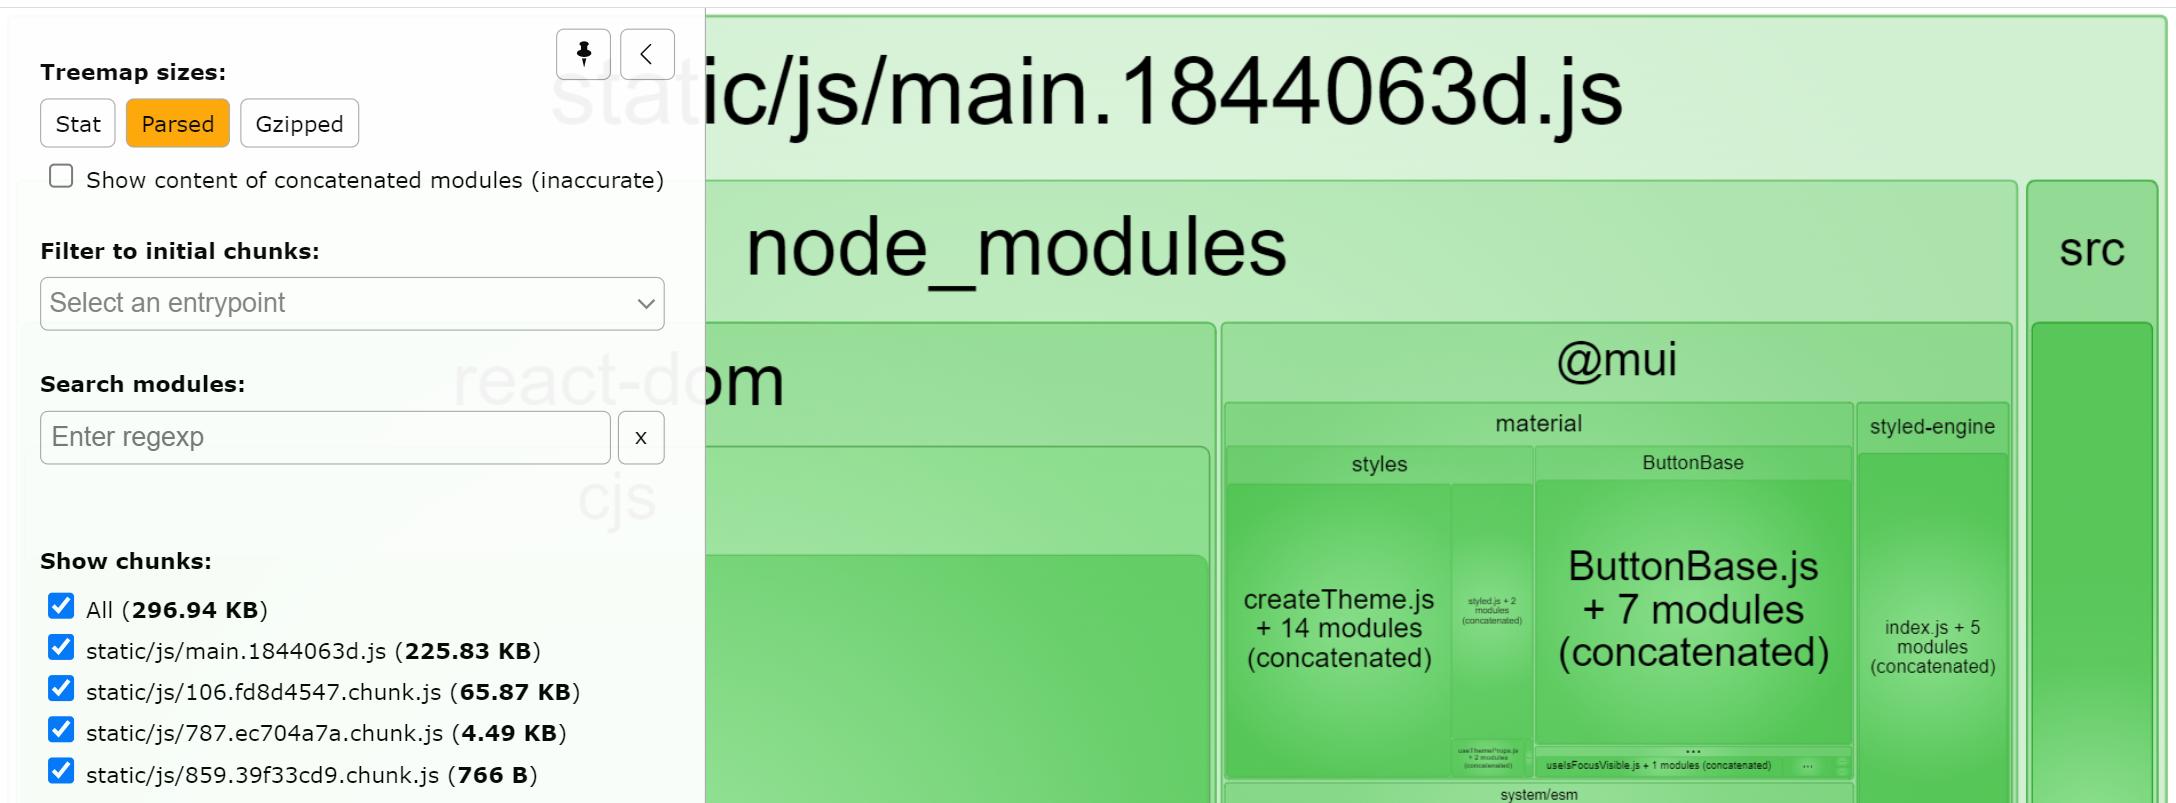
From above, you can see the bandwidth has dropped from 710 KB to 296KB.
Conclusion
The Webpack bundle analyzer helps you analyze and know what to optimize for better performance of your applications. You can identify potential performance bottlenecks and optimize your code for improved performance, and this results in faster load times and better user experiences.
